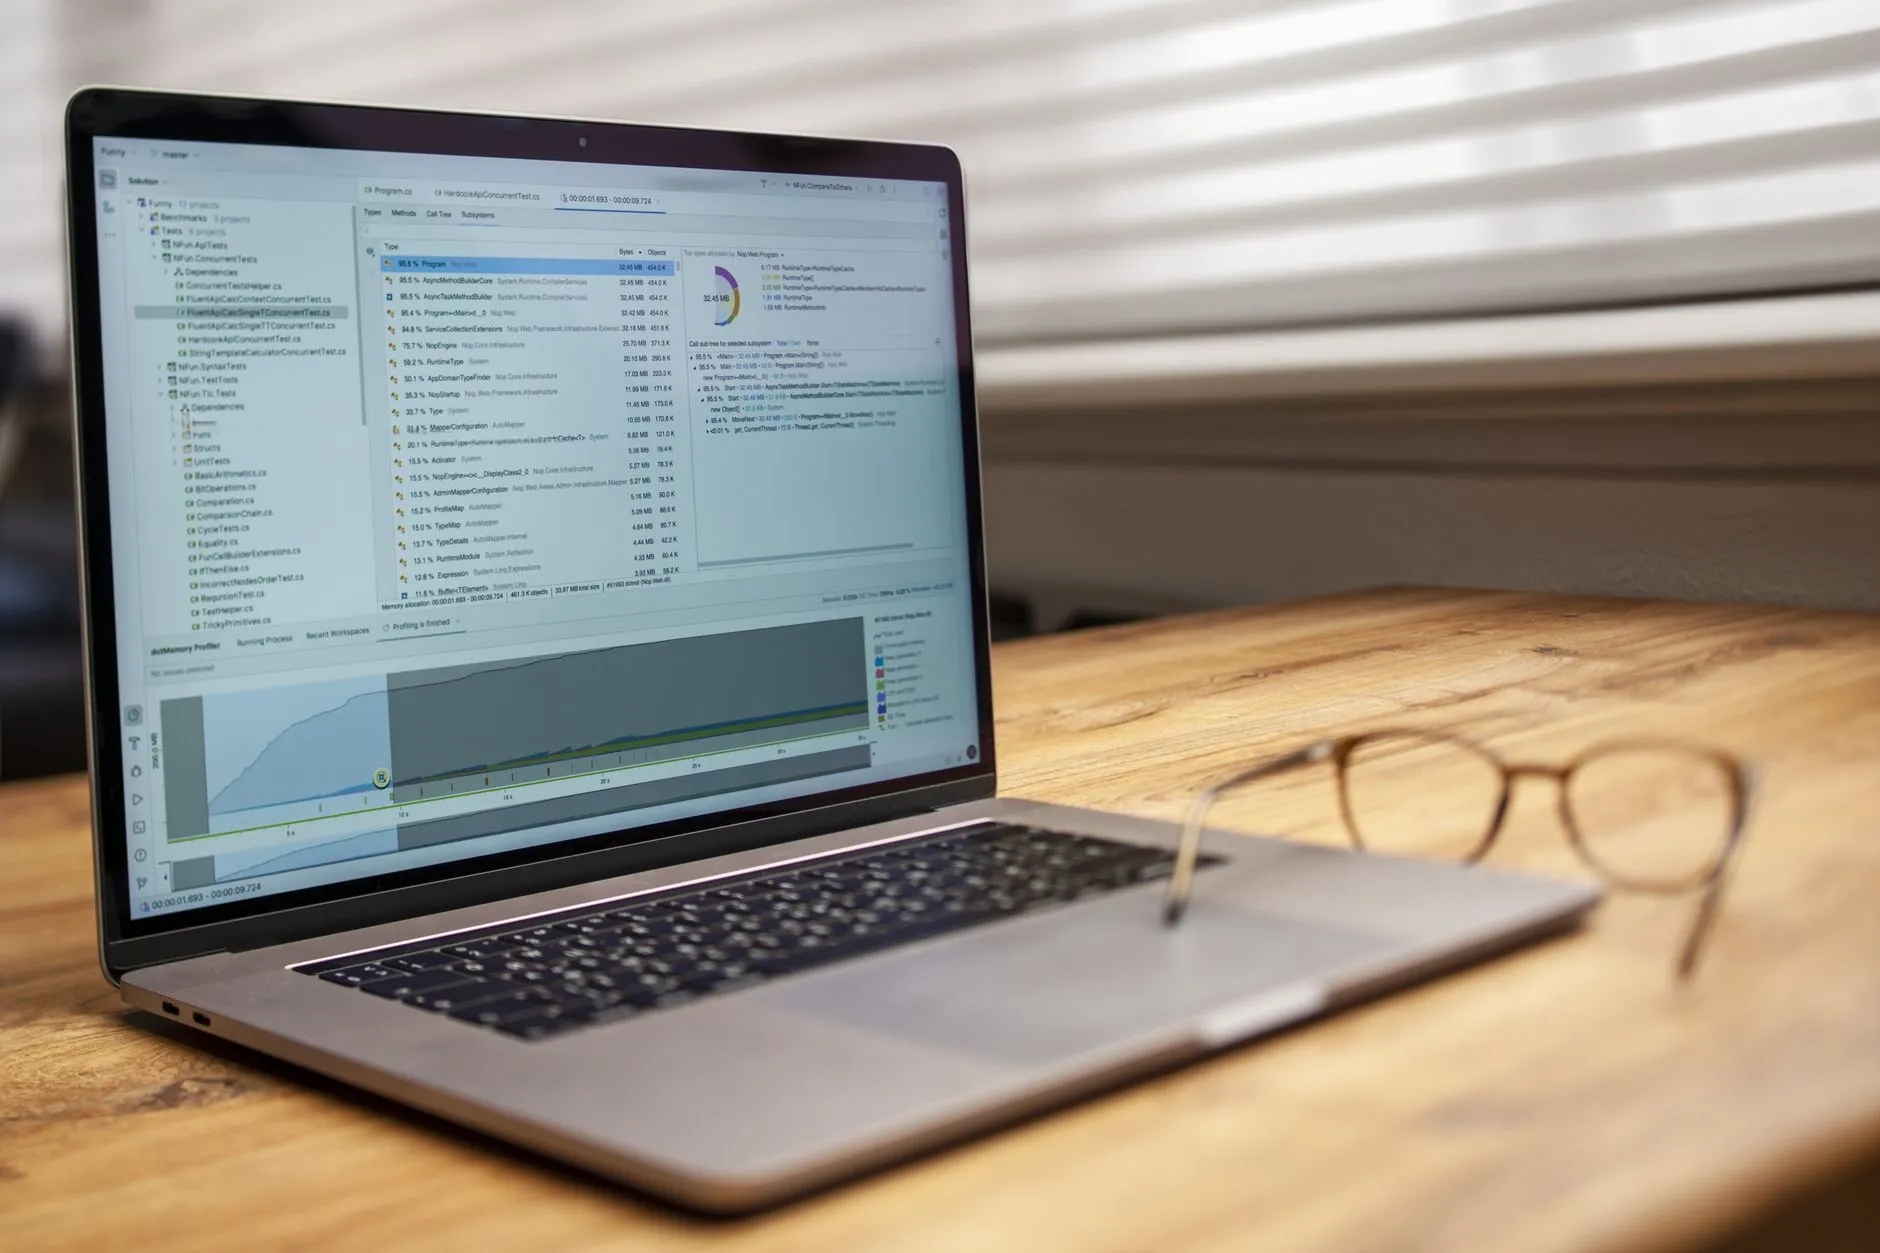
Home/ Business Intelligence/Dashboard Development
Dashboard development company
Avaib designs and builds clear, fast dashboards around the decisions you make — the few numbers that matter, in a reading order anyone can follow — with the data modelled underneath so every figure is quick and trustworthy. Not a wall of every chart that is technically possible.
Delivered for teams in Australia, the United States, Canada and the Middle East.
A screen that answers the question
Dashboard development is designing and building the single screen that turns your numbers into a clear, live answer — so anyone can see how things are going and decide what to do at a glance.
The trouble is that most dashboards are built to show everything. Thirty or forty metrics land on one screen, half of them there because they were available rather than useful, and the result is a screen people cannot read. It is slow, the numbers do not quite agree, and after a fortnight it is back to exporting to a spreadsheet.
Avaib builds the other kind. We start from the decisions the dashboard has to support, lead with the few numbers that actually matter, choose the right chart for each question and model the data underneath so it loads fast and every figure holds up — delivered by one senior team, dashboards and data models you own, at a cost-effective senior rate.
Built a dashboard before and watched it gather dust? That is exactly the pattern we are built to break.
Get a free quoteWhat we build
From a single view for the leadership team to analytics built into your own product — each one designed around the questions the people using it actually ask.
A single, glanceable view of how the business is doing right now — the handful of numbers leadership steers by, above the fold, with the detail a click away.
Pipeline, conversion, targets and forecast in one place, so the sales team and the people they report to are looking at the same live picture instead of last week’s export.
Revenue, margin, spend and cash position kept current, so you are not waiting for month-end to know where you stand and can act while it still matters.
The live signals your operation runs on — throughput, SLAs, stock, utilisation — surfaced clearly so problems are caught early instead of explained after the fact.
Spend, channels, leads and return pulled together from the tools they are scattered across, so you can see what is actually working without stitching six reports by hand.
Analytics built directly into your own product or portal, matching your brand and design, so your customers get their numbers inside the tool they already use.
Not sure which you need first? That is what the first conversation is for.
Get a free quoteWhy most dashboards fail
This is how expensive dashboards quietly stop being used. It is the single most common pattern, and every part of how Avaib designs is built to avoid it.
Wanting to be thorough, the dashboard ends up showing thirty or forty numbers at once — every chart that is technically possible, plus a few vanity metrics that look good but drive no decision.
With that much on screen and no clear hierarchy, people burn energy just finding the number that matters. It is built to serve every role at once, so most of it is noise to any one person reading it.
A screen that takes effort to read and is slow to load gets opened less and less. The dashboard that was meant to speed up decisions quietly becomes one more thing nobody checks.
A dashboard is not judged by how much it shows — it is judged by how fast it answers the one question that matters. Showing less, in the right order, is the whole craft.
What good looks like
Every dashboard Avaib builds is designed to be read in seconds and trusted every day, not switched on and quietly forgotten.
Every dashboard we build starts from the question it must answer and the action it should trigger. If a chart does not help someone decide something, it does not earn a place on the screen.
We lead with the handful of figures that actually move the business, placed where the eye lands first, and push the supporting detail below or a click away — so the point is readable in seconds.
A trend gets a line, a share gets a bar, a target gets a gauge. We choose the visual that makes the answer obvious, rather than whatever the tool defaulted to, so nobody misreads it.
A slow dashboard is an unused dashboard. We model the data behind the scenes so views open in a second or two, even over a lot of history, instead of leaving people waiting and giving up.
Filters and drill-downs let people go from the headline number to the why behind it on their own, so the dashboard settles arguments in the meeting instead of spawning another report request.
Each figure is defined once and checked against source, so the dashboard agrees with finance and the CRM. Trust is what decides whether people keep opening it after the first month.
How a good dashboard is read
A dashboard people actually use is built in a clear reading order. The headline answers land instantly; the detail is there when someone needs it. Here is how we lay it out.
The top of the screen answers "are we okay?" — a small set of headline numbers with a clear up/down signal, readable without scrolling or thinking. Most people need only this most days.
Below that sit the supporting charts that answer "what is driving this?" — trends and breakdowns that add the context behind the headline, for when a number looks off.
Filters and drill-downs let someone follow a thread all the way to the individual record, then take the action — so the dashboard ends in a decision, not just a chart to admire.
The fears, answered
These are the real concerns we hear before a dashboard project starts. Here is exactly how Avaib takes each one off the table.
Why Avaib
Plenty of firms can hand you a set of charts. Our whole model is built to deliver dashboards that are fast, trusted and actually used.
We do not just style charts — we model the data underneath them too. That means the dashboard is fast, consistent and trustworthy all the way down, not a pretty layer over a shaky foundation.
We start from the question the dashboard must answer and cut everything that does not serve it. That single discipline is the biggest reason our dashboards get used where others gather dust.
Since 2004 and across 600+ projects, we have built reporting on the full range of real-world business systems, so we know how to make messy data read clearly on a single screen.
Senior data and dashboard specialists from around USD 25 per hour — the same capability Australian, US, Canadian and Middle-East firms charge a fortune for, at a fraction of the price.
Our senior engineers use advanced AI coding tools to move faster through the data modelling and dashboard build, steering and reviewing every step, so you get working reporting sooner without cutting corners on clarity or accuracy.
A dedicated QA function checks each number against source before you launch, so you trust the dashboard from day one — the thing that decides whether it survives its first month.
The models, the queries, the dashboards and the documentation all stay yours. No lock-in, no per-change dependency — a relationship you keep because it delivers, not because you are trapped.
Want dashboards your team will finally rely on, without the big-firm price tag?
Get a free quoteHow we work
Understand the decisions first, shape the data behind it, design a clear layout, build and test against source, then hand over and refine.
We start with who will use the dashboard, the questions they need answered and the actions they take, so we design around real use rather than a wish-list of every possible chart.
We connect and model the data so it is clean, consistent and fast — defining each metric once and pre-aggregating where needed, so the dashboard is quick and every figure agrees.
We lay out the screen with a clear reading order — headline numbers first, supporting detail below, drill-downs on demand — and choose the right chart for each question, then agree it with you.
We build the dashboard, check every number against the source system, and tune load speed, so what launches is accurate, fast and does exactly what the design promised.
We give you the models and documentation, show your team how to run and extend it themselves, and refine the views once real use shows what people reach for most.
Pricing
Senior data and dashboard specialists from around USD 25 per hour, the same capability Australian, US, Canadian and Middle-East firms charge a fortune for, at a fraction of the price. We scope each engagement up front so you commit knowing the price, and every build leaves you owning your dashboards and the data models behind them outright.
One focused dashboard designed, built and tested to an agreed scope and fixed budget — data modelling included — so you get a clear, fast, trusted view of the one thing you most need to see, and you own all of it.
A connected set of dashboards across teams or functions, built on one shared, consistent data foundation, so every view agrees and the whole business reads from the same numbers.
Customer-facing dashboards built into your own application or portal, matching your brand and design, delivered by a senior team and handed over for you to own and extend.
Every engagement is delivered by senior specialists under one accountable team, with each figure checked against source by a dedicated QA function, and handed over with the models and documentation so you can run it yourself — no lock-in. Not sure how big a first step makes sense? We will recommend it on a free scoping call and send you a free, no-obligation written estimate with a clear scope.
Want a clear read on what your dashboard should cost and where to start?
Get a free quoteGet an honest read on the dashboard that would give you that answer fastest, a sensible plan and a ballpark price, free and with no obligation.
Get a free quoteWho we help
If getting a clear picture out of your own data is harder than it should be, here is the kind of organisation Avaib fits, and the problem we usually solve for each.
Technologies
We are not tied to one vendor's stack. We choose the right dashboard tool for your team and build it on a solid, fast data foundation. Here is the landscape we work in.
In our clients' words
Rated 4.5/5 on Google and 5/5 across other platforms, with 10+ written references and 80%+ client retention.
"We have dealt with Avaib as our sole software provider for over 9 years now with very few issues. I would recommend their services anytime."
"Round-the-clock availability of business managers and IT teams is one of Avaib’s greatest assets. They have always surpassed my expectations. I highly recommend Avaib to everyone."
"Avaib understood our needs and have been catering customised solutions that have exceeded our expectations."
Common questions
Dashboard development is the work of designing and building a single screen that turns your business data into clear, live answers — the charts, numbers and layout that let someone see how things are going and decide what to do at a glance. Good dashboard development services cover both halves of the job: the visual design of the dashboard itself, and the data modelling underneath it that makes every number fast, consistent and trustworthy.
The difference between a dashboard that gets used and one that gathers dust is almost never the tool — it is the design discipline. Industry research repeatedly finds the average executive dashboard crams thirty to forty metrics onto one screen, far more than anyone can read, so people give up on it. Avaib has built reporting across more than 600 projects since 2004, and develops dashboards decision-first — the few numbers that matter, in a clear reading order, fast to load — so they actually get opened.
Business intelligence is the whole system — connecting your data sources, bringing them into a reliable store, and defining what each metric means. Dashboard development is the visible layer on top of that: the screens people read and act on. You can think of BI as the plumbing and the dashboard as the tap.
A dashboard is only as good as the data feeding it, which is why we deliver both together. If you already have a solid BI foundation, we build the dashboards on top of it. If you do not, we model the data as part of the work so the dashboard is fast and every figure holds up. Our broader business intelligence solutions cover the full stack.
Almost always because they were built to show everything rather than to answer a specific question. When thirty or forty metrics compete on one screen with no clear hierarchy, people cannot tell where to look, so they stop looking. Slow load times and numbers that do not match the rest of the business finish the job.
We design against every one of those causes: we start from the decisions the dashboard must support, lead with the few numbers that matter, choose the right chart for each, make sure it loads fast, and check every figure against source. A focused, trusted, quick dashboard is one people keep opening.
All of the major ones, plus custom and embedded builds. We work in Microsoft Power BI, Tableau, Looker and Looker Studio, Qlik and Microsoft Fabric, and for analytics built into your own product we build custom dashboards with tools like D3.js, Chart.js and React on top of platforms like Snowflake and BigQuery.
We recommend the tool that fits your team, your existing systems and your budget rather than pushing one product. Because you own the data models and the dashboards, you are never locked into a single vendor and can change the reporting layer later if your needs shift.
Yes. Embedded, customer-facing dashboards are a core part of what we do. We build analytics directly into your application or portal, matching your brand and design so it feels like a native part of the product rather than a third-party widget bolted on.
That covers the reporting your customers see, the access controls that keep each customer’s data separate, and the performance work that keeps it fast at scale. You own the build and can extend it as your product grows.
Almost always, yes. Slow dashboards usually come from querying large amounts of raw data live every time someone opens a view. The fix is in the data layer, not the charts: we model and pre-aggregate the data so the dashboard reads from something purpose-built and fast.
We can take on an existing dashboard, find where the time is going, and rebuild the parts that need it so views open in a second or two. Often the visuals barely change — it is the plumbing underneath that we put right.
It depends on how many data sources need connecting and how many dashboards you need — a single focused dashboard on data that is already clean is very different from a suite of connected dashboards across the business. That is why we scope each engagement up front and give you a clear, fixed price before any commitment.
Delivery is staffed by senior data and dashboard specialists at a cost-effective rate of around USD 25 per hour — the same capability Australian, US, Canadian and Middle-East firms charge a fortune for. After a short conversation we will send you a free, no-obligation written estimate with a clear scope.
Yes. We build with self-service in mind and hand over the data models, the dashboards and the documentation, along with a walk-through so your team can adjust filters, add a view or change a target without depending on us for every small change.
If you would rather we keep evolving them, we can do that too — but the choice is yours, because you own everything. A relationship with Avaib is one you stay in because it keeps delivering, not because you are locked in.
Got a question that isn't here? Ask it on the quote form, we answer every one.
Get a free quoteExplore more
A dashboard rarely stands alone. Explore the parts that fit your situation, or let us map the whole picture with you.
A dashboard sits on top of a full BI solution — data integration, a warehouse and agreed metrics. See the whole picture.
Learn more →Better reporting is often one piece of a wider change in how the business works and decides.
Learn more →Once the numbers are clear, put AI to work on forecasting and the decisions behind the charts.
Learn more →Connect the systems your numbers live in so data flows into your dashboards automatically.
Learn more →Where a dashboard needs to become a tool people act inside, we build the software around it.
Learn more →Automate the manual report-building so the dashboard is fed and refreshed on its own.
Learn more →Book a free consultation. No jargon, just an honest read on the clearest screen we can give you fastest, and what it would take.
Get a free quote